
I Just Wanted to Know Why My Internet Was Slow. I Ended Up Building a Device to Monitor It.
A Raspberry Pi, a wrong Ethernet adapter, a tiny OLED, Grafana, a 3D-printed case, and far more engineering than I expected from a simple question: is my internet actually working properly?
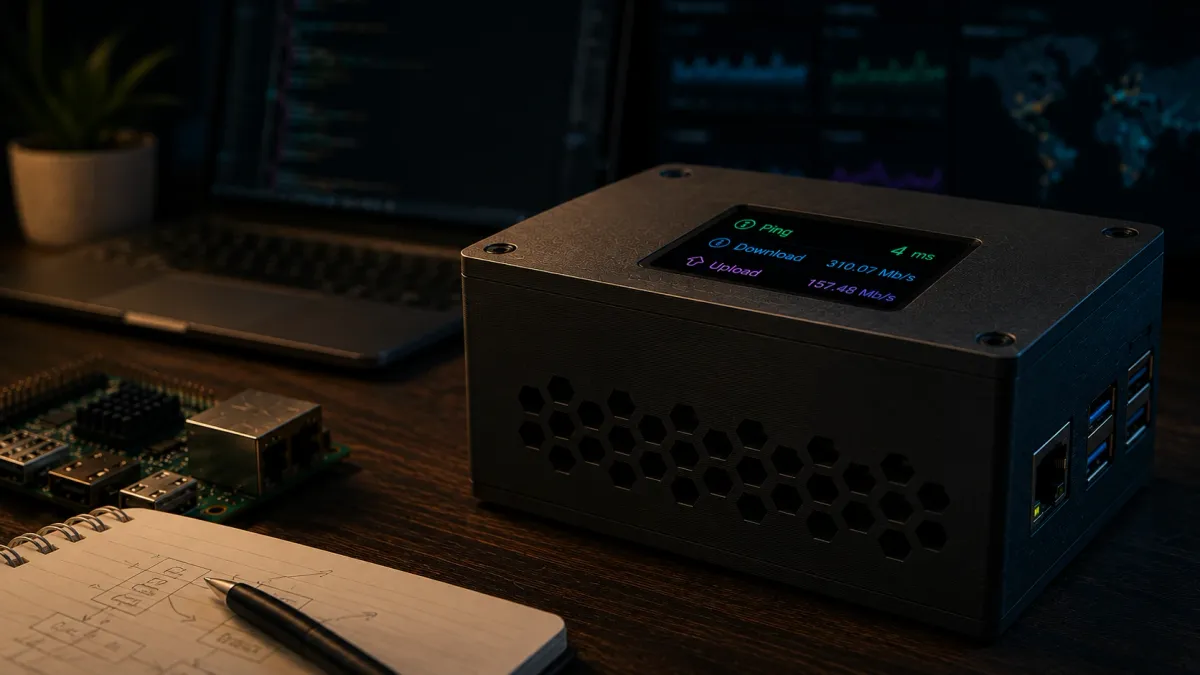
Some projects start with an idea. This one started with irritation. Not long ago, I spent far too much time trying to understand why a connection that was supposed to be much faster kept behaving like a 100 Mbps line. That story eventually became The 100 Mbps Mystery. Every Conclusion Was Wrong!. I found the problem, fixed it, and finally got the speed I was paying for.
Technically, the problem was solved. But one question stayed with me: how do I know it will stay solved?
Running a speed test manually tells me what is happening right now. It tells me almost nothing about what happened at 3 a.m., whether the connection degraded for twenty minutes yesterday, whether latency changes at certain hours, or whether a problem is local or somewhere farther away. I already use observability for servers and services. So at some point the obvious question appeared: why was I treating my internet connection differently?
I wanted a small device that could sit on the network, measure it continuously, store the history, and make the current state visible without opening a laptop. What looked like a tiny weekend utility slowly turned into a complete little hardware project.
The first version was deliberately boring
The first hardware choice was a Raspberry Pi Zero 2 W. It was cheap, tiny, powerful enough for the job, and I already knew exactly how I wanted the software side to work. The device did not need to serve traffic or run a heavy application. It only needed to execute measurements, publish telemetry and survive unattended.
The first version was intentionally simple: run tests on a schedule, collect ping, download and upload results, and push the measurements into the same monitoring stack I already use elsewhere. For normal measurements I did not want to invent a speed-test protocol. Ookla already has a mature network of servers and a CLI that gives me exactly the basic numbers I need. The monitor runs those tests periodically and publishes the result as telemetry.
But a single speed-test result is not enough to understand a network. A fast nearby server can tell me that the last few kilometers are fine while saying almost nothing about the route I actually care about. So I also added measurements against different regions. Europe, North America and Asia give me a much more useful picture of what is happening beyond my local ISP edge.
The frequent checks stay lightweight. More expensive tests run less often. The point is not to saturate my own connection every few minutes in the name of monitoring it. It is to build history.
Then I made the classic hardware mistake
The Zero 2 W has Wi-Fi, but measuring a wired internet connection over Wi-Fi immediately introduces another variable. If the result becomes worse, what exactly changed? The ISP? The router? Interference? Signal strength? The access point?
For a measurement device, that is unnecessary ambiguity. I wanted Ethernet. So I ordered an Ethernet HAT.
It worked. And it was limited to 100 Mbps.
I had somehow managed to build a device for monitoring a connection faster than 100 Mbps and then put a 100 Mbps bottleneck directly inside the measuring device. That is the kind of mistake that looks ridiculous after you find it and completely reasonable while you are debugging it.
The adapter was replaced with a gigabit-capable one, and suddenly the numbers made sense again. This small failure actually reinforced the reason for building the monitor in the first place. A measurement is only useful if you understand the measurement path. Otherwise the monitoring system can become the thing creating the problem you are trying to observe.
From speed tests to observability
Once the measurements were reliable, the project stopped being a speed-test script. The device publishes telemetry, the data lands in my metrics storage, and Grafana turns it into something I can inspect over time.
That changes the kind of questions I can ask. Instead of "is the internet slow right now?" I can look at how download speed behaves throughout the day. I can compare upload stability. I can see latency spikes. I can compare remote regions. And, most importantly, I have data from before the moment I noticed a problem.
That last part is the real difference. Without history, debugging starts when the symptom becomes annoying enough for a human to notice it. With history, I can go backwards.
The monitor itself does not need to understand why something happened. It just needs to be boring, consistent and always there.
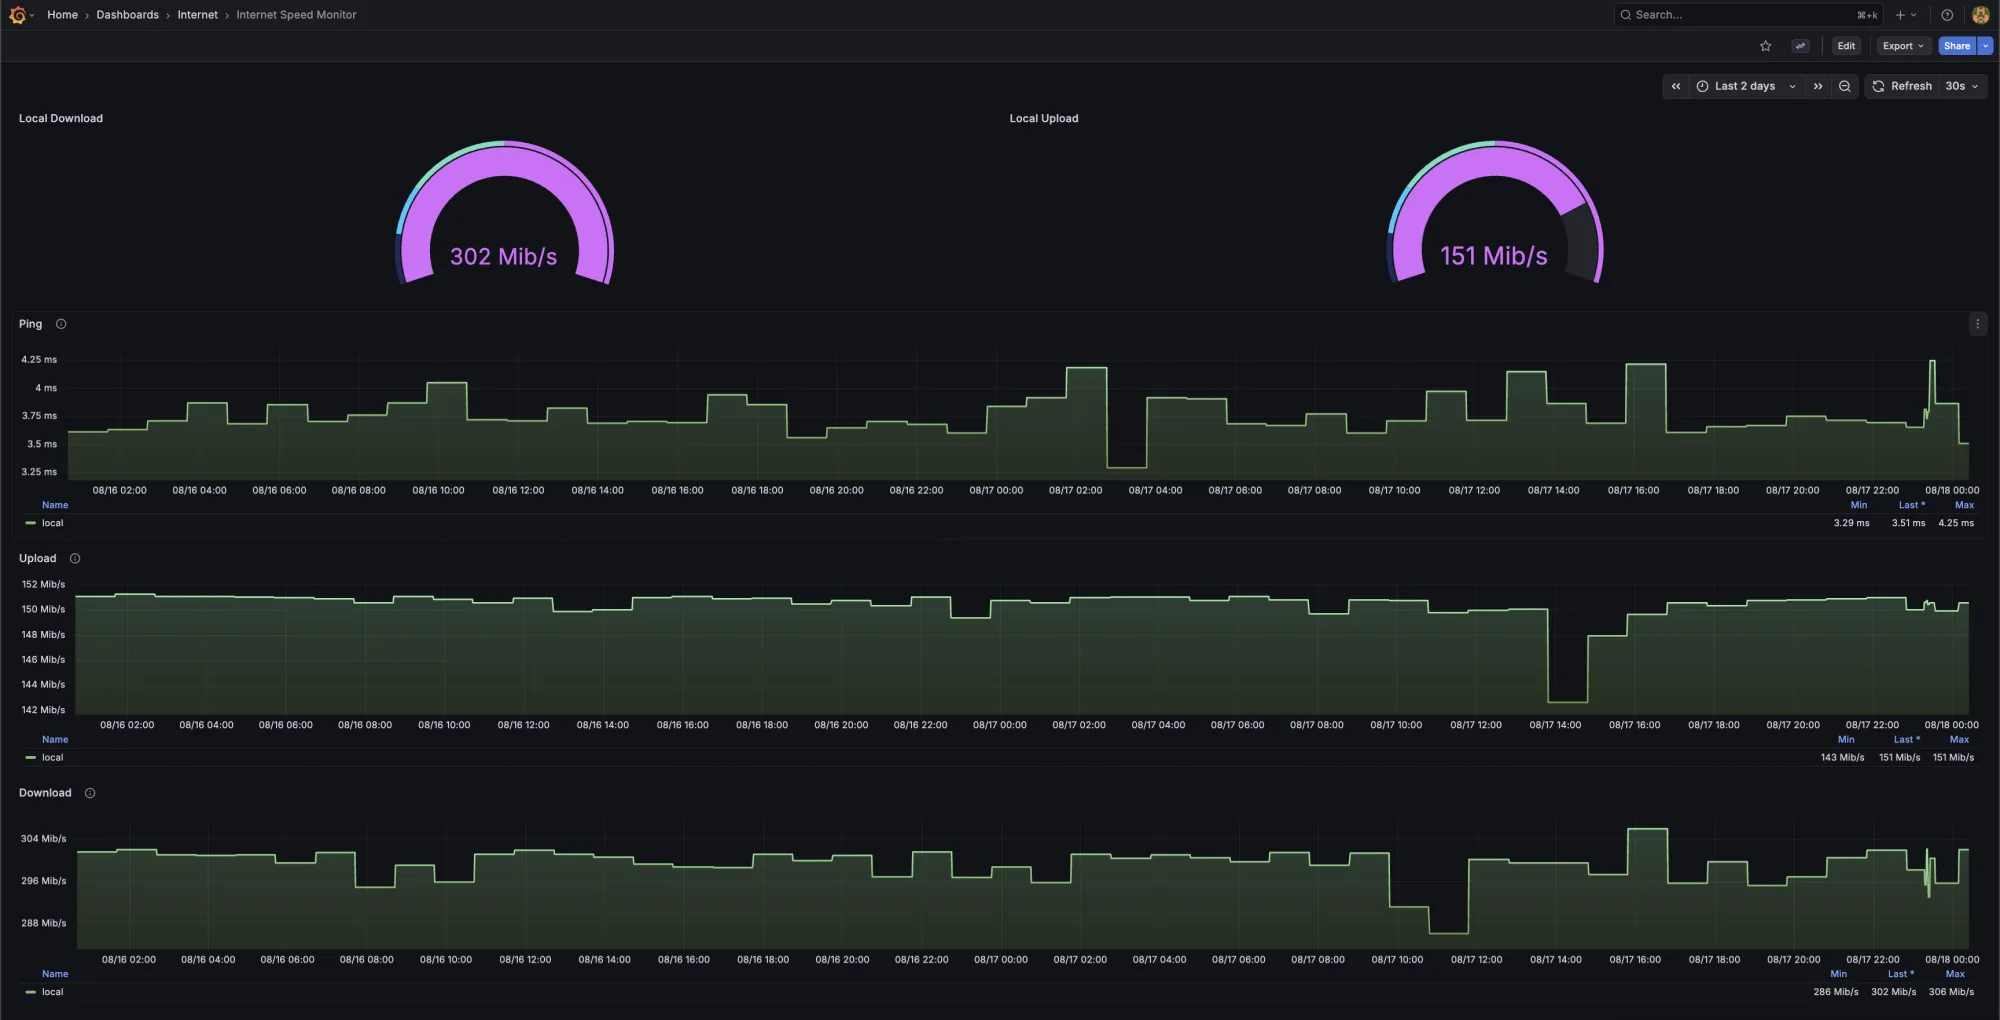
I wanted it to work without Grafana too
At this point I already had the useful part of the project. The Raspberry Pi could sit somewhere unnoticed and send metrics forever. But I did not want another anonymous black box connected to my network.
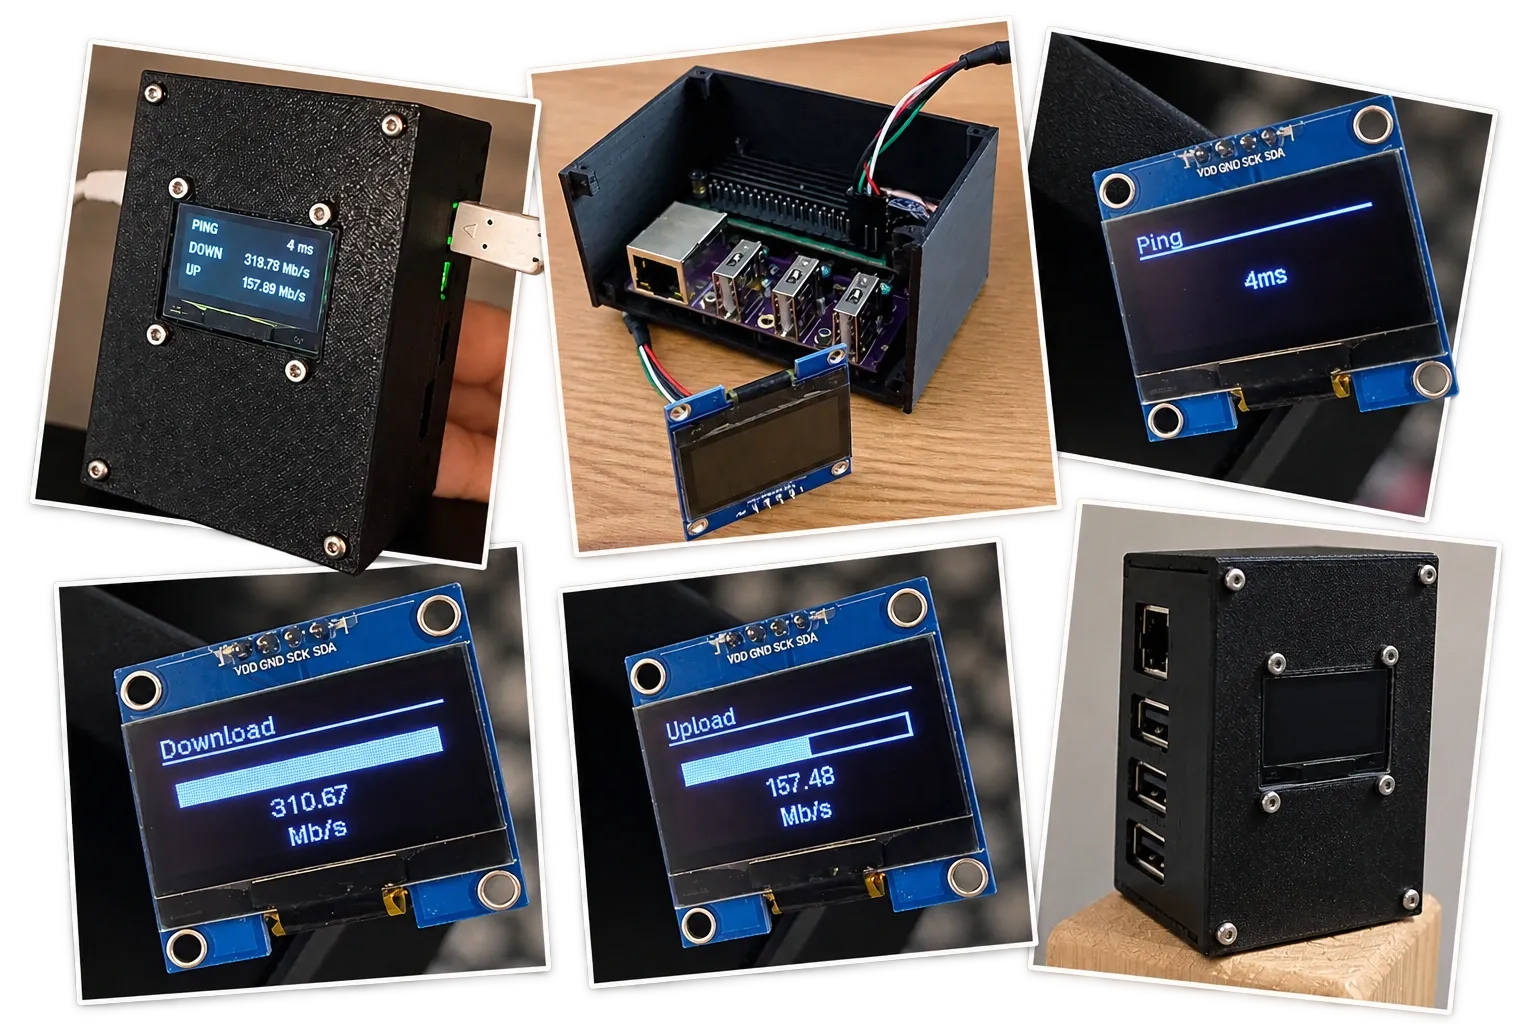
I wanted to be able to walk past it and immediately see what the latest measurement looked like. That is where the OLED appeared.
The first screen was almost comically simple. Show Ping, run the test, then Download, then Upload. Later I added progress states and finally a compact summary with all three values. The display does not replace Grafana. It solves a completely different problem.
Grafana is where I go when I want to investigate. The OLED is where I look when I just want an answer.
That distinction made the physical device suddenly feel justified instead of decorative.
And then the project became mechanical
Of course, once there is a display, an Ethernet adapter, a Raspberry Pi and cables, leaving everything loose on a desk stops being charming very quickly. I needed a case.
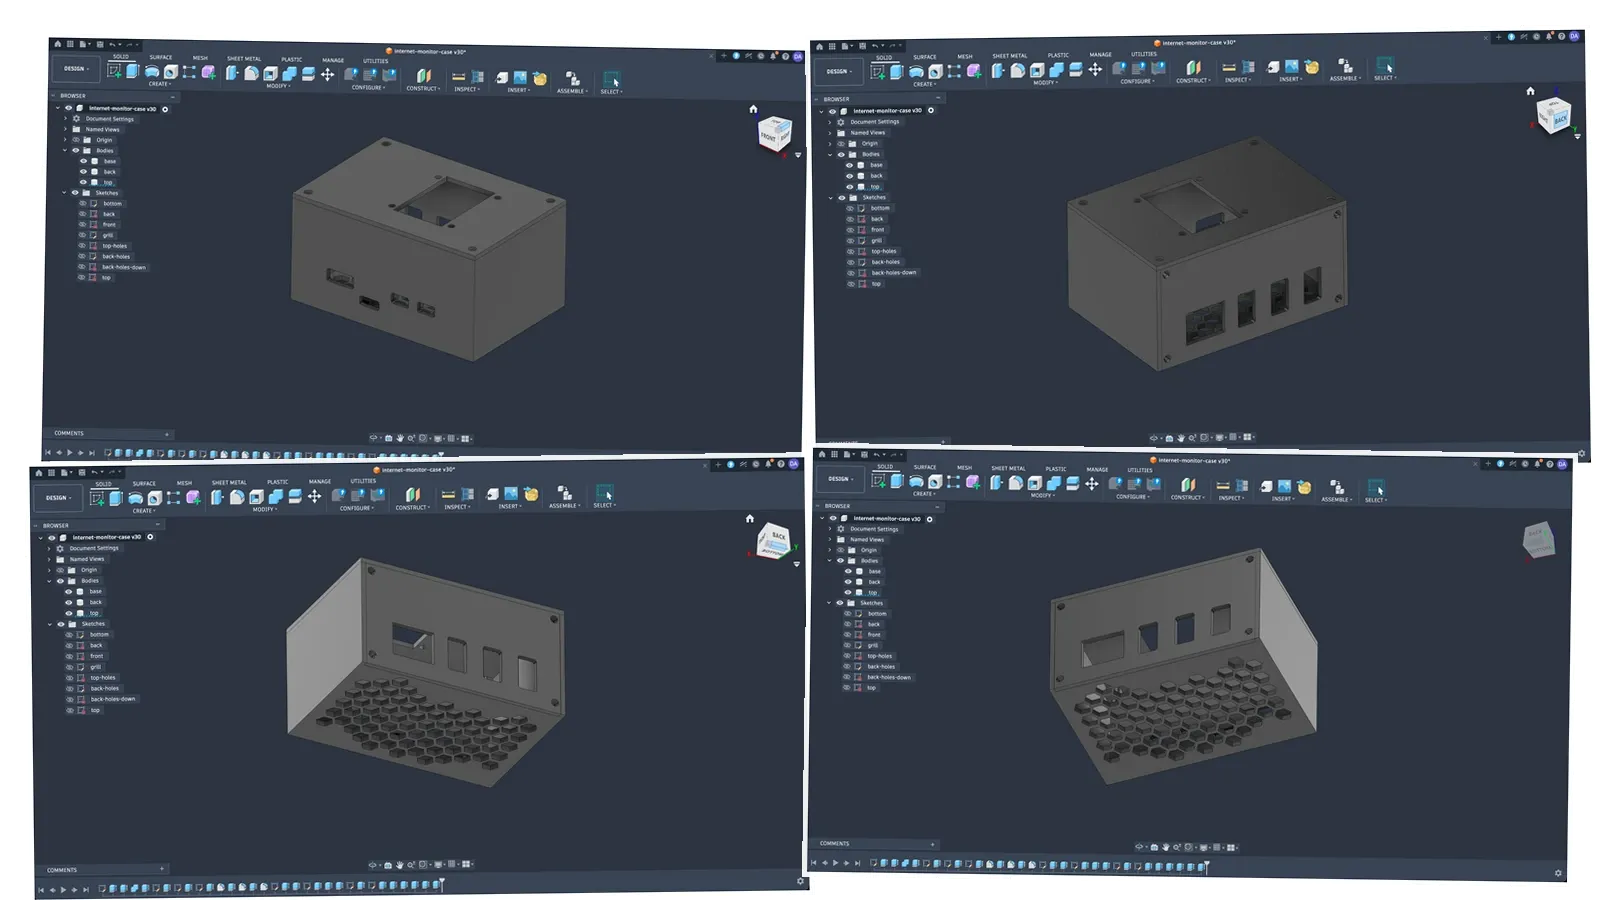
This is where a project that had started as a few Python scripts turned into Fusion 360, calipers, test prints, screw holes, port clearances and ventilation. The enclosure had to expose the actual ports I use, hold the OLED securely, give the electronics enough airflow and still be printable without turning the design into a nightmare.
I went through many revisions. The Fusion file eventually reached internet-monitor-case v30, which is a fairly accurate summary of how "I'll quickly make a box for it" usually goes. The final design is split into printable parts and uses screws instead of pretending that the first snap-fit idea would magically be perfect. The bottom has a honeycomb ventilation pattern, the side panels expose the required connectors, and the OLED sits in its own front opening.
It is not an industrial product enclosure. It does not need to be.
It is a case designed around one specific device, on my desk, for a problem I actually have. That freedom is one of my favorite things about owning a 3D printer.
Hardware
The final device is intentionally simple. There is no exotic hardware hidden inside it:
- Raspberry Pi Zero 2 W - the computer running the measurements and telemetry.
- RPi0 3U1GE Raspberry Pi Zero 2 W Gigabit Ethernet expansion board - the correct gigabit adapter for this build.
- Raspberry Pi Zero 2 W Ethernet / USB HUB HAT (B) - the wrong adapter I tried first; it is limited to 100 Mbps.
- 1.3 Inch OLED Display Parent - the local UI for Ping, Download and Upload.
- microSD card and power supply.
- 3D-printed enclosure - designed specifically around this hardware.
The enclosure is split into three printable parts. Download them here:
- Download
base.stl- main enclosure body. - Download
back.stl- rear panel. - Download
top.stl- top/front panel with the OLED opening.
The parts are held together with screws, and the design includes the OLED opening, connector cut-outs, and ventilation for this specific build. Treat the files as a starting point and check your own hardware dimensions before printing.
The software and setup instructions are available in the internet-speed-monitor GitHub repository.
The finished device is almost boring
And I mean that as a compliment. Now it sits on the network, connected by Ethernet, running its measurements and publishing telemetry. The screen shows the latest ping, download and upload values. If I want more context, I open Grafana and have the history waiting for me.
There is no cloud dashboard that the hardware depends on. No subscription. No vendor deciding that the product is end-of-life. The important parts are just a Raspberry Pi, a small display, some code and a box I can print again whenever I decide version 31 is absolutely necessary. The funny part is that none of the individual pieces are particularly complicated.
Running a speed test is easy. Sending metrics is easy. Displaying three values on an OLED is easy. Printing a rectangular enclosure is easy. But connecting all of those pieces into something reliable exposed exactly the kind of problems that make small engineering projects interesting: the wrong network adapter, measurement methodology, schedules, physical tolerances, cooling, cable placement, port access and dozens of tiny decisions that do not exist in the first sketch.
This is why I like building unnecessary things
I could have solved the original problem with a cron job. Honestly, that would have been enough.
But then I would have had a cron job. Instead, I now have a physical piece of my infrastructure. I can see it, modify it, print another case, change the measurement strategy, add another metric or completely repurpose it later.
More importantly, the project changed the relationship I have with the problem. Before, "the internet feels slow" was an event. I noticed it, investigated it and tried to reconstruct what had happened.
Now the network is simply another system producing telemetry. That is a much more comfortable place for an engineer to be.
And if the connection decides to mysteriously become 100 Mbps again, this time I will have the graphs. Hopefully the bottleneck will not be inside my own monitor.