
The 100 Mbps Mystery: Every Conclusion Was Wrong
After upgrading from 100 to 300 Mbps, the home connection still felt slow. We built monitoring, found several convincing causes, and were wrong almost every time.

A few months ago, I upgraded my home internet plan from 100 Mbps to 300 Mbps.
The provider confirmed the change, the new plan was visible in the customer portal, but in practice nothing seemed to change at home. The connection still felt roughly the same. Pages loaded, video streamed, but I never saw the speed jump I expected.
Of course, feelings are not measurements. Maybe there was no real problem at all. So instead of immediately blaming the provider or replacing hardware, we started with data.
Start With Measurements
The first step was opening Speedtest and checking the connection on different devices around the house.
We tested laptops, phones, and desktop computers. We compared Wi-Fi and wired connections. We also checked devices as close to the router as possible to understand whether the limit was in the wireless network, somewhere in the home infrastructure, in the router itself, or already on the provider side.
The results were inconsistent. One device would show higher speeds, another lower ones. Repeated tests could differ noticeably. Individual measurements gave us numbers, but not a reliable picture.
We could not tell whether there was a permanent limit or whether the speed changed during the day. Maybe the issue only appeared during peak hours. Maybe Wi-Fi was the problem. Maybe one specific device was.
At some point it became clear that we were no longer measuring the system. We were just collecting random results.
That was the moment we decided to automate the process.
From One-Off Tests to Monitoring
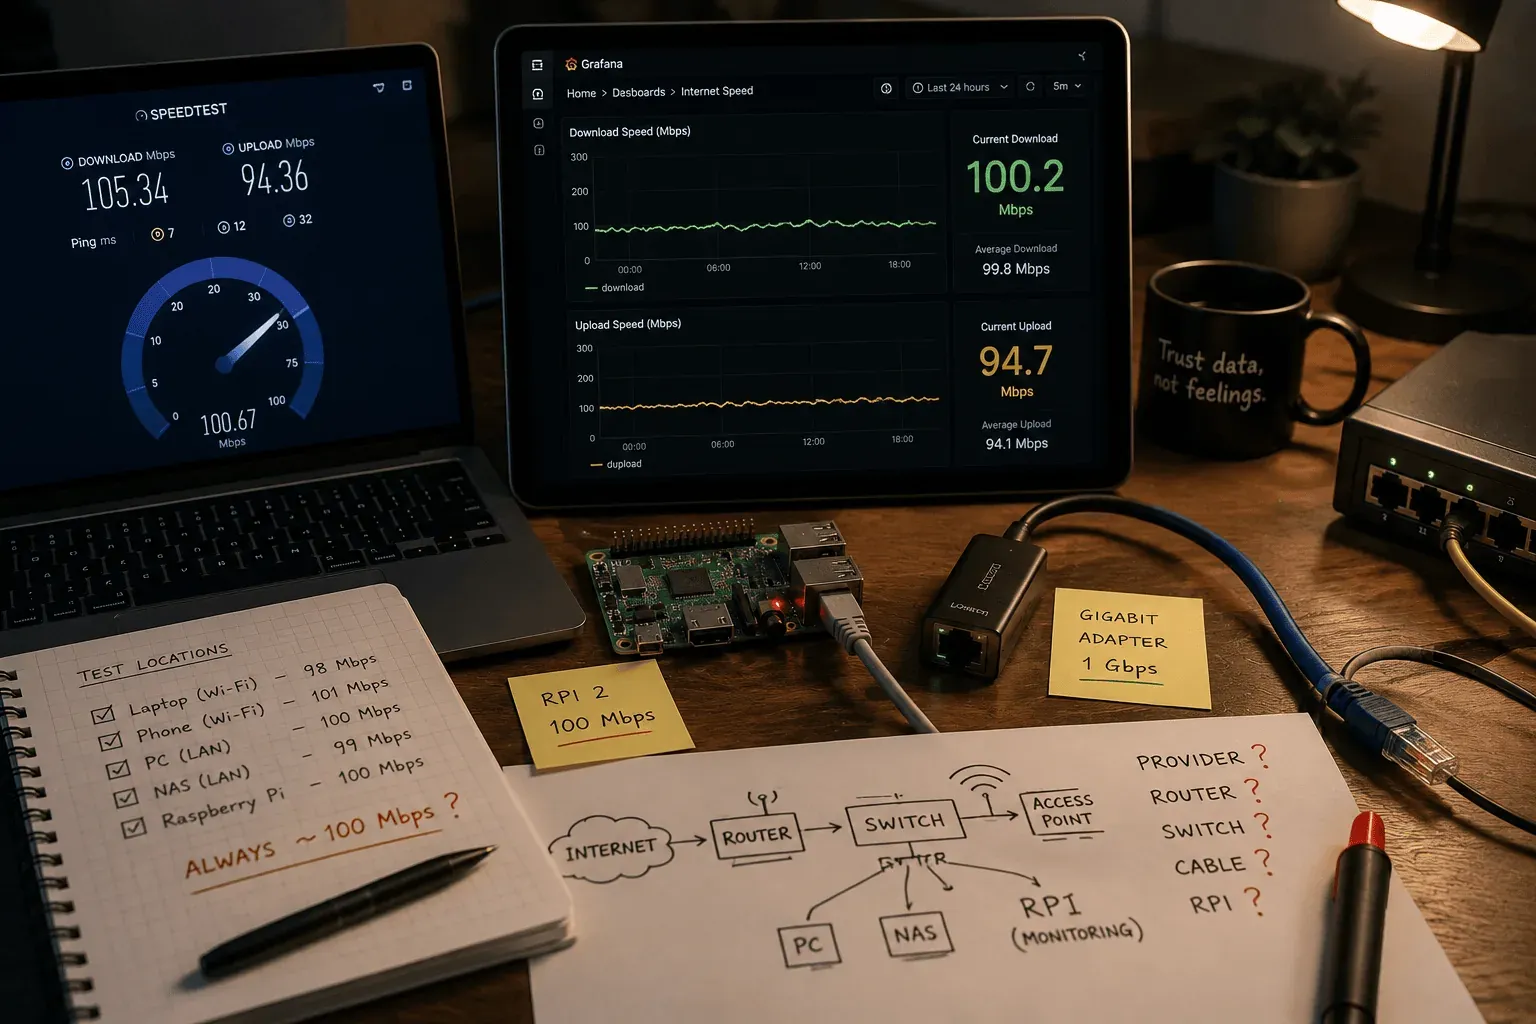
I had a Raspberry Pi available, so we set up a small service on it. It ran speed tests on a schedule, stored the results, and sent the data into Grafana.
Instead of a handful of manual checks, we could now see history:
- how the speed changed during the day;
- whether there were regular drops;
- how stable the ping was;
- whether there was a hard ceiling;
- whether the results matched at different times.
After a while the dashboard started filling with data.
And almost every test seemed to hit the same number: 100 Mbps.
Not 230. Not 270. Not random jumps between different values. Almost a perfect ceiling at around one hundred megabits.
At the time, that looked like strong confirmation of our theory. The plan had already been switched to 300 Mbps, but somewhere in the chain there was clearly still an old limitation.
As it turned out later, that was exactly the point where we went in the wrong direction.
When Monitoring Measures Itself
For several days we tried to figure out where the missing 200 Mbps had gone.
We checked settings, studied the network layout, looked at the router, switches, and access points. The graph looked too stable to be a coincidence. It looked like a real physical limit.
The problem really was physical. It just was not where we were looking.
At some point we checked the Raspberry Pi itself and its network interface. It turned out that the board used for monitoring was limited by a 100 Mbps Ethernet connection.
Our measurement system could not physically show more than 100 Mbps.
The graphs were not lying. They were showing the speed available to the measuring device itself. We had simply assumed that we were measuring the full internet connection.
For several days, we had been investigating the limitation of our own tool.
After replacing the network board with a gigabit RJ-45 interface, the monitoring system finally gained the ability to see the real speed. That ruled out the first big false hypothesis, but it still did not solve the original problem.
Checking the Whole Chain
The investigation had to start almost from scratch.
We walked through the home network one component at a time:
- cables;
- switches;
- the controller;
- access points;
- device connections;
- router ports.
Eventually we found that one network controller had been connected incorrectly and was operating through a port limited to 100 Mbps.
That looked like the answer.
We fixed the connection and removed another limit from the chain. But the expected 300 Mbps still did not appear where it should have.
Another convincing conclusion turned out to be incomplete.
The Router Remains
After checking the home infrastructure, the list of suspects narrowed down a lot. Only the router and the provider connection were left.
In the router interface we found the key detail: one of the links was still negotiated at 100 Mbps.
We tried switching ports, reconnecting cables, and rebooting the equipment. The provider did not want or could not refresh the link state properly from its side, so we had to fully drop and renegotiate the connection.
After a full reconnect, the port finally came up at gigabit speed.
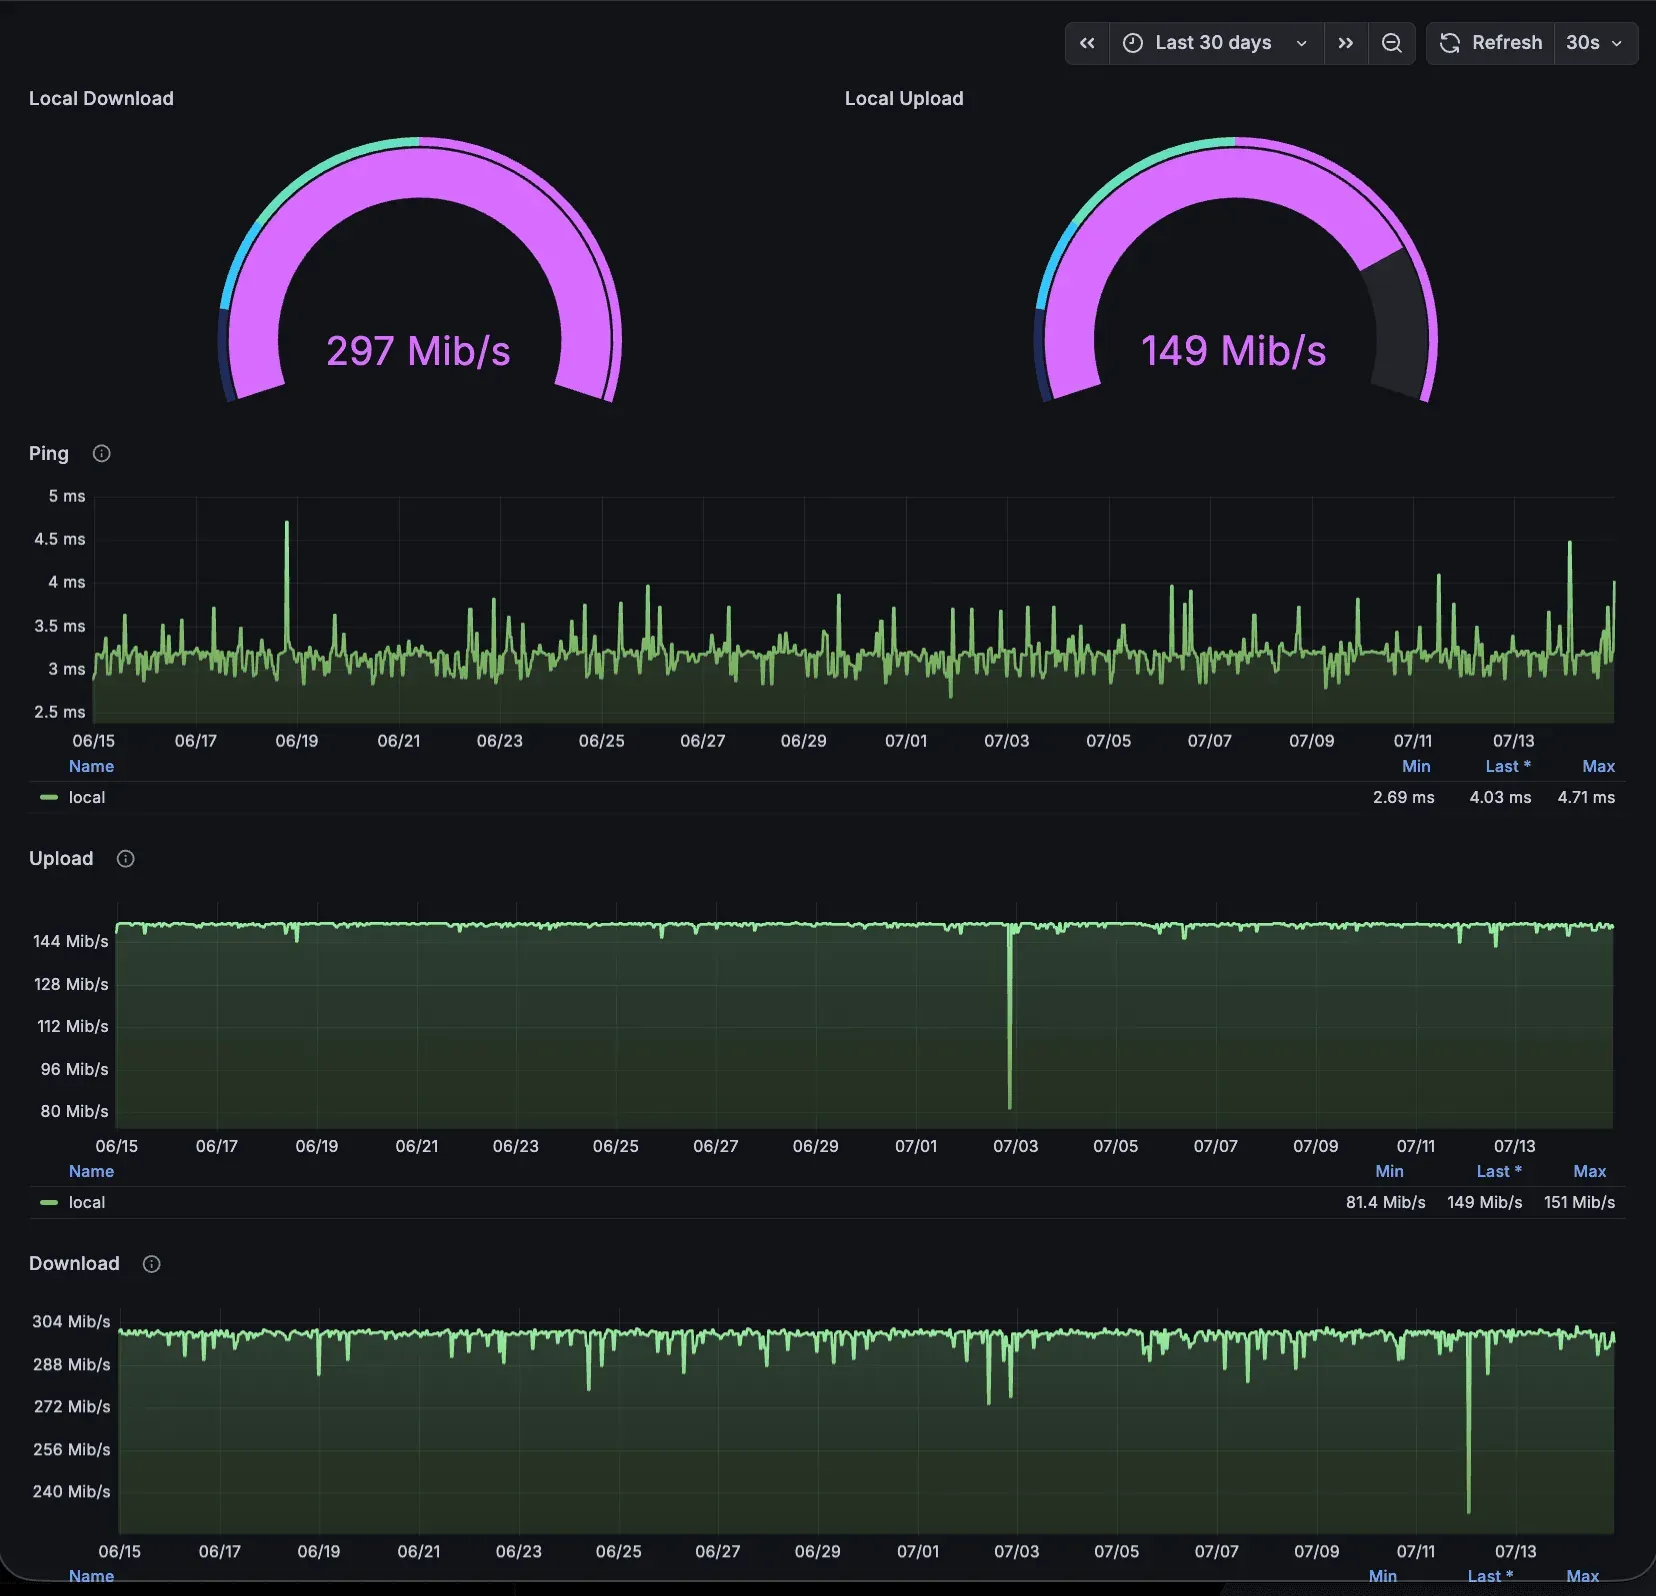
And almost immediately the tests started showing the expected numbers around 300 Mbps.
Every Conclusion Was Wrong
Looking back at the whole story, almost every intermediate conclusion sounded reasonable.
At first, we suspected Wi-Fi or individual devices.
Then the automated monitoring confirmed a stable 100 Mbps ceiling.
After that, we discovered that the Raspberry Pi itself was limited.
Then we found the incorrectly connected controller.
Each new discovery looked like the final answer. But each one either described only part of the system or was about the measuring tool itself.
The real cause was further down the chain: the port had not renegotiated its speed after the plan change and had kept running in the old mode.
What the Debugging Left Behind
The main lesson from this story is not that you should simply reboot your router.
First: the measurement tool is part of the system. If it is limited, misconnected, or misconfigured, it can create a very convincing false picture.
Second: the problem you find is not always the root cause. In a complex chain there can be several independent limits, and removing one of them does not mean the whole system is fixed.
Third: a stable number like 100 Mbps often points to a physical or negotiated limit. That is a useful clue, but it does not tell you where the limit actually lives.
And finally: good debugging is not about inventing an explanation as quickly as possible. It is about checking each link in order and refusing to treat a plausible hypothesis as a proven fact.

Nice graphs help you see the problem. But first you have to make sure your monitoring system is capable of seeing the truth.