
The Hunt for a Performance Bug in My Raspberry Pi NAS
A debugging story about false assumptions, disappearing disks, power issues, Grafana dashboards, and why observability became a core engineering principle in my home infrastructure.
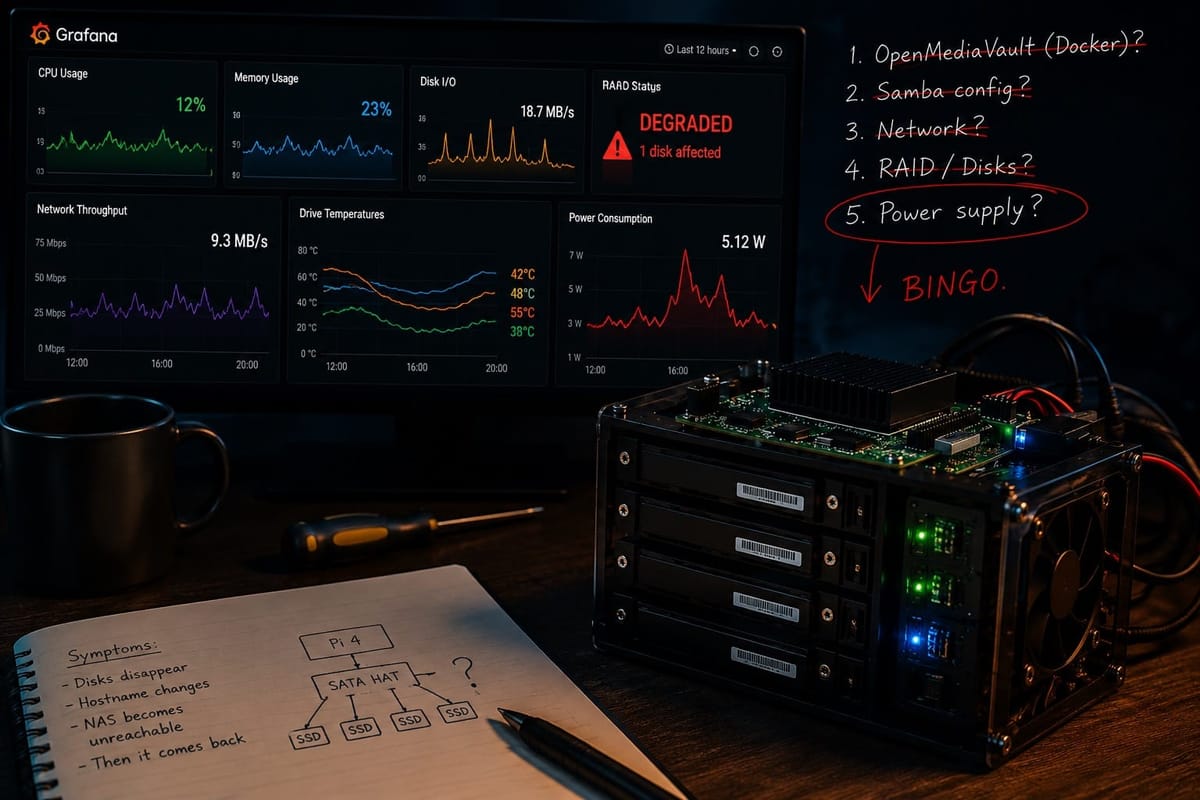
After the previous article, it would be easy to think that the project was mostly finished. The hardware was assembled. RAID was configured. Samba was serving files. The custom enclosure was working. From the outside, the NAS looked like a small finished system quietly doing its job in the background.
But that is rarely how real engineering projects behave. A system only starts telling the truth after it has been running for a while. Not during the first boot. Not during the clean setup. Not when everything is still on the desk and you are watching it closely. The real problems appear later, when the device becomes part of daily infrastructure and you stop touching it every hour.
That is exactly when my NAS started misbehaving.
The First Symptoms
At first, the symptoms looked random. The NAS could run normally for days. Then, without any obvious reason, one of the disks would disappear. Sometimes the hostname changed. Sometimes the NAS simply became unreachable over the network. A few minutes later, everything came back as if nothing had happened.
Those are the worst bugs to debug. If something fails immediately, you can reproduce it. If something fails under load, you can stress-test it. But when a system works for days and then suddenly breaks for a few minutes, you are no longer debugging a single command. You are investigating a crime scene after the suspect has already left.
The first list of possible causes was long: OpenMediaVault, Docker, Samba, network configuration, RAID, disks, SATA controller, power supply. At that point, everything was suspicious.
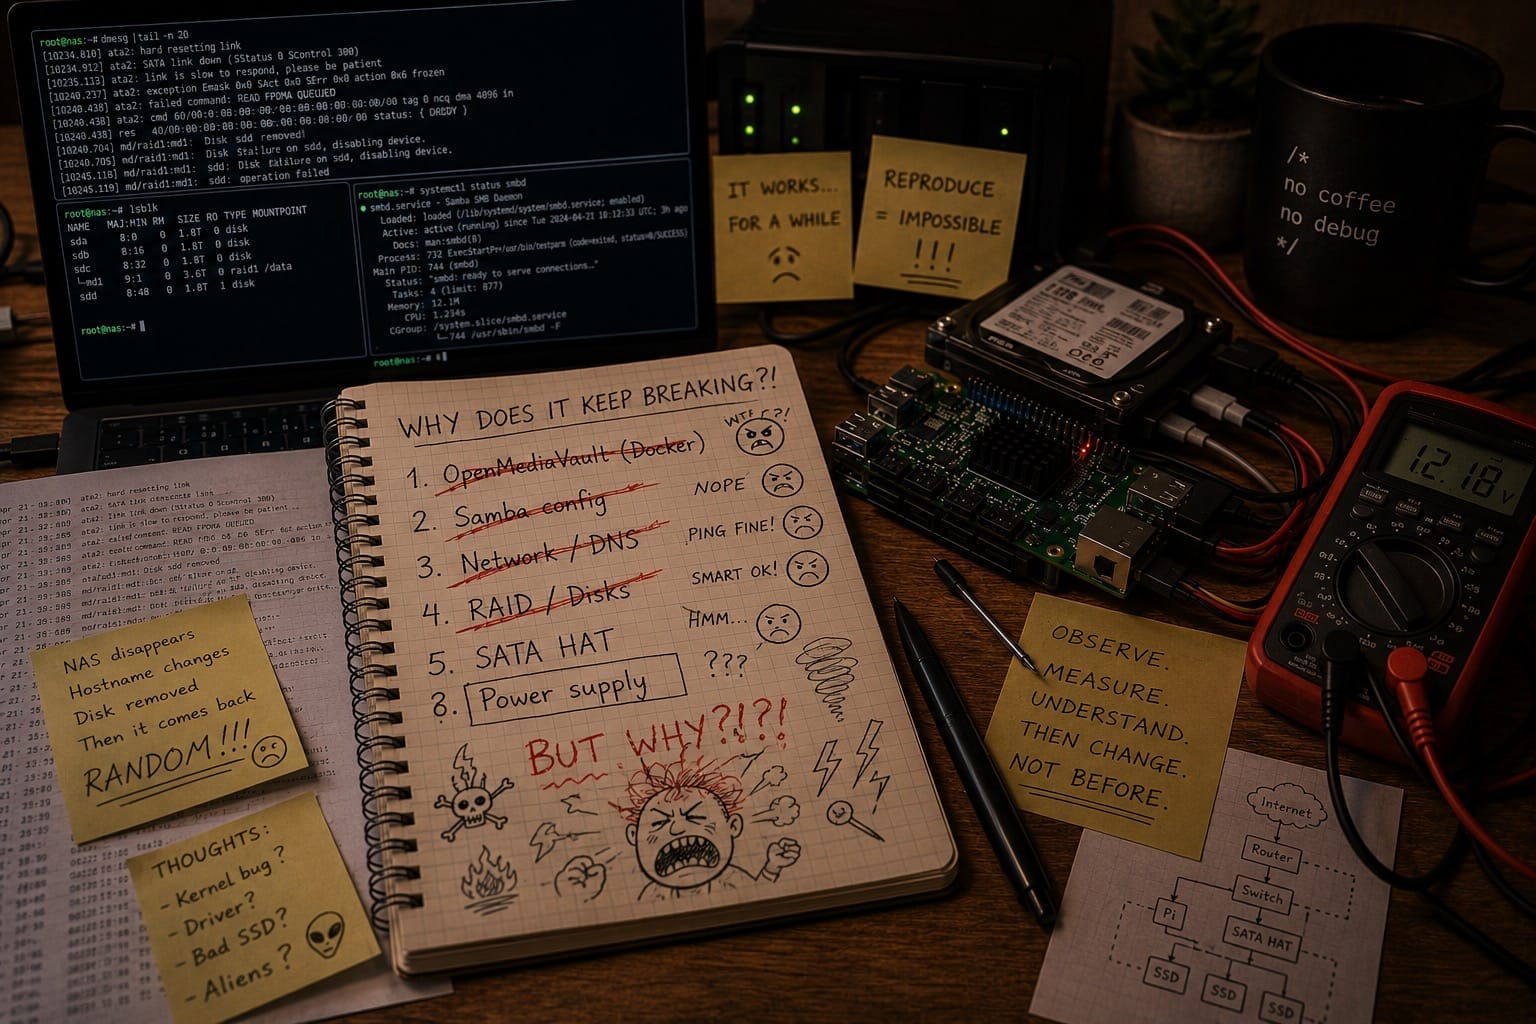
The First Hypothesis Was Wrong
At that time, the NAS was still running through OpenMediaVault, and OpenMediaVault itself was deployed on top of Docker. The first hypothesis felt very convincing. Maybe there were too many layers. Maybe Docker was adding overhead. Maybe OpenMediaVault was consuming more resources than expected. Maybe the system was simply too heavy for the Raspberry Pi.
It was a clean and attractive explanation. That made it dangerous. I decided to remove OpenMediaVault completely. The NAS was migrated to a clean Debian setup. RAID was configured manually. Samba was configured directly. Everything unnecessary was removed. The system became much thinner and much easier to reason about.
For a moment, it felt like the problem should be gone. It was not. The same behavior came back. A disk disappeared again. The NAS became unreachable again. The system still looked healthy most of the time, and then suddenly failed in the same strange way.
That was the first important lesson of this debugging story: a convincing hypothesis is not the same thing as a correct hypothesis. The migration from OpenMediaVault to Debian was still useful in the long run, because it gave me more control over the system. But it did not fix the problem. The root cause was somewhere else.
Things I Tried That Did Not Help
Before finding the real cause, I went through a long list of changes and checks. I replaced the OpenMediaVault setup with clean Debian. I reconfigured Samba manually. I checked network settings. I looked at hostname resolution. I checked whether the NAS was disappearing because of local DNS, mDNS, DHCP, or some other network-level problem. I reviewed RAID state. I checked SMART data. I inspected kernel logs. I looked for disk errors, controller resets, and suspicious messages around the time of each failure.
Some of those checks were useful. None of them solved the problem. That is an uncomfortable but important part of debugging. Most investigation steps do not directly fix anything. Their value is that they eliminate possible causes and make the search area smaller.
But only if you measure carefully.
Grafana Became an Investigation Tool
At some point, it became obvious that logs alone were not enough. The issue was intermittent. It did not happen while I was looking at the system. It happened at some random time, usually when the NAS had been running normally for a while. By the time I noticed the problem, the most interesting part had already happened.
That is where Grafana changed the project. At first, the dashboard was simple. CPU usage. Memory usage. Filesystem usage. Basic network throughput. Later I added disk throughput, disk latency, RAID status, SMART-related data, temperatures, uptime, and alerts.
The dashboard did not fix the NAS. But it changed the debugging process completely.
Before Grafana, the investigation sounded like this:
It feels like the NAS randomly disappears.
After Grafana, the questions became much more specific:
What happened just before the disk disappeared?
Did CPU usage spike?
Did I/O wait increase?
Did temperature rise?
Did the RAID state change?
Did power health change?
Did the same disk always fail?
Did the system recover by itself?
That shift from feelings to data was the turning point.
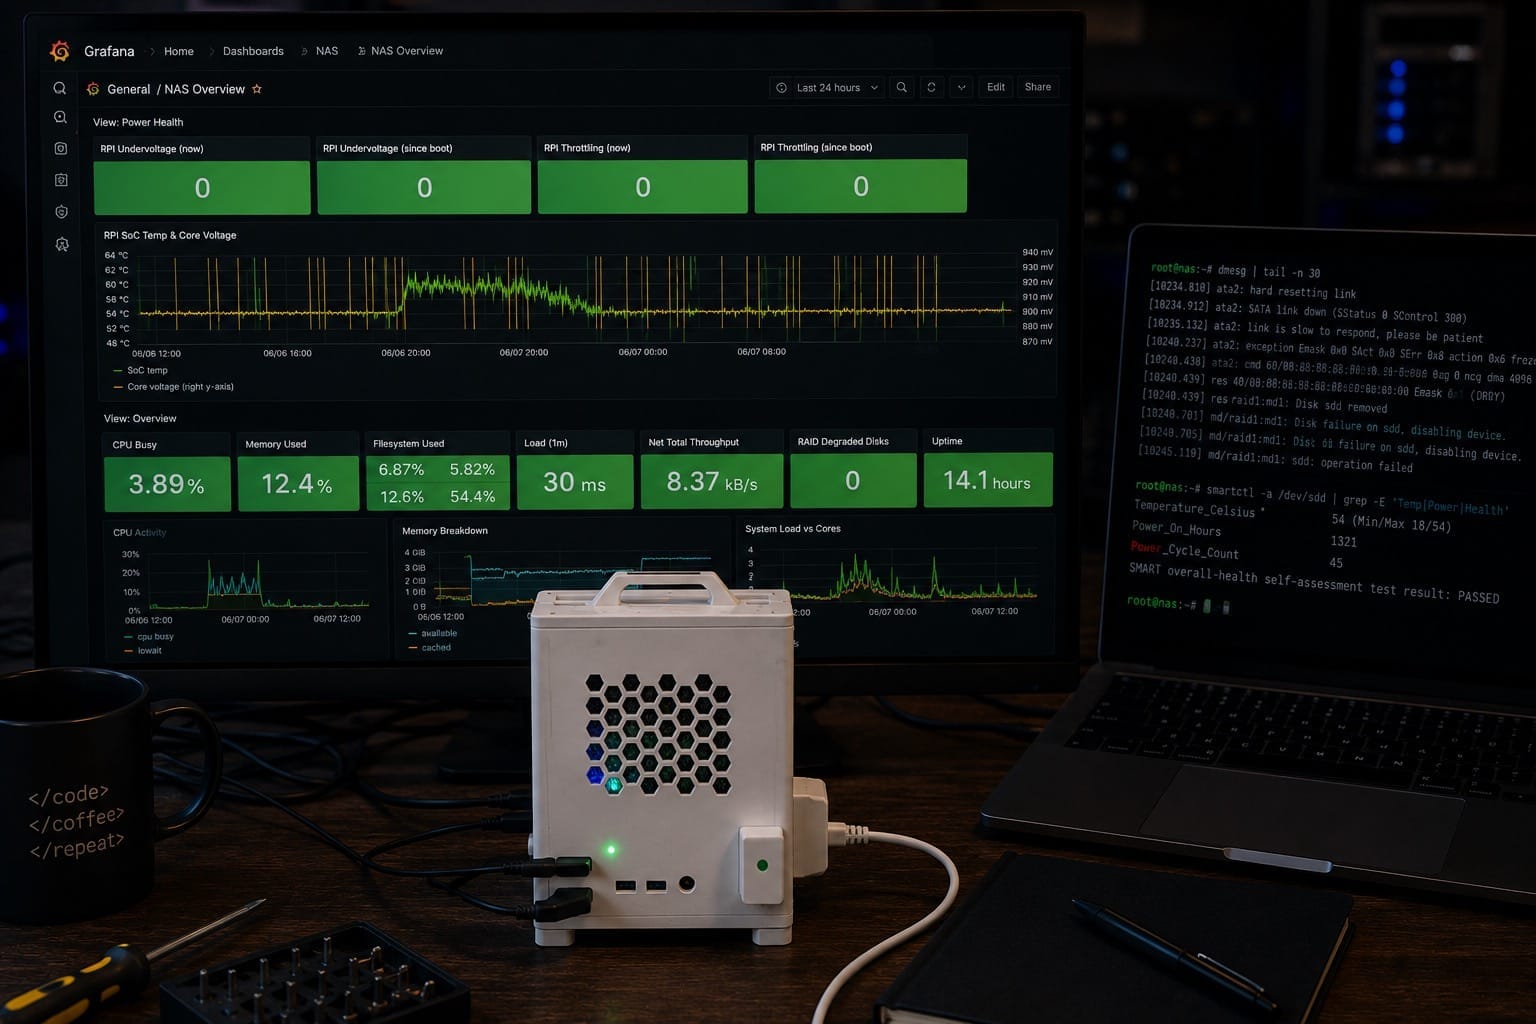
Adding Power Metrics
The real breakthrough came when I started looking at power. At first, I was focused on software. Then on storage. Then on the SATA HAT. Power felt too boring and too obvious, which is probably why it took longer than it should have.
The Raspberry Pi and the Radxa SATA HAT were powered separately. The Raspberry Pi had its own power supply. The SATA HAT and the disks had another one. That detail turned out to be critical.
The Raspberry Pi itself looked stable. The system could boot, serve files, and run normally for long periods. But the disk controller did not always have enough current headroom. Under certain conditions, especially when disks were active, the SATA side could become unstable.
From the outside, it looked like a software problem. A disk disappeared. The NAS became unreachable. The hostname changed. Samba connections dropped. RAID reported issues. Logs pointed in many directions, but none of them clearly said: your power supply is too weak.
Once we started correlating power-related metrics with failures, the picture became much clearer. The culprit was not OpenMediaVault. It was not Docker. It was not Samba. It was not the network.
It was insufficient power for the storage side of the system.
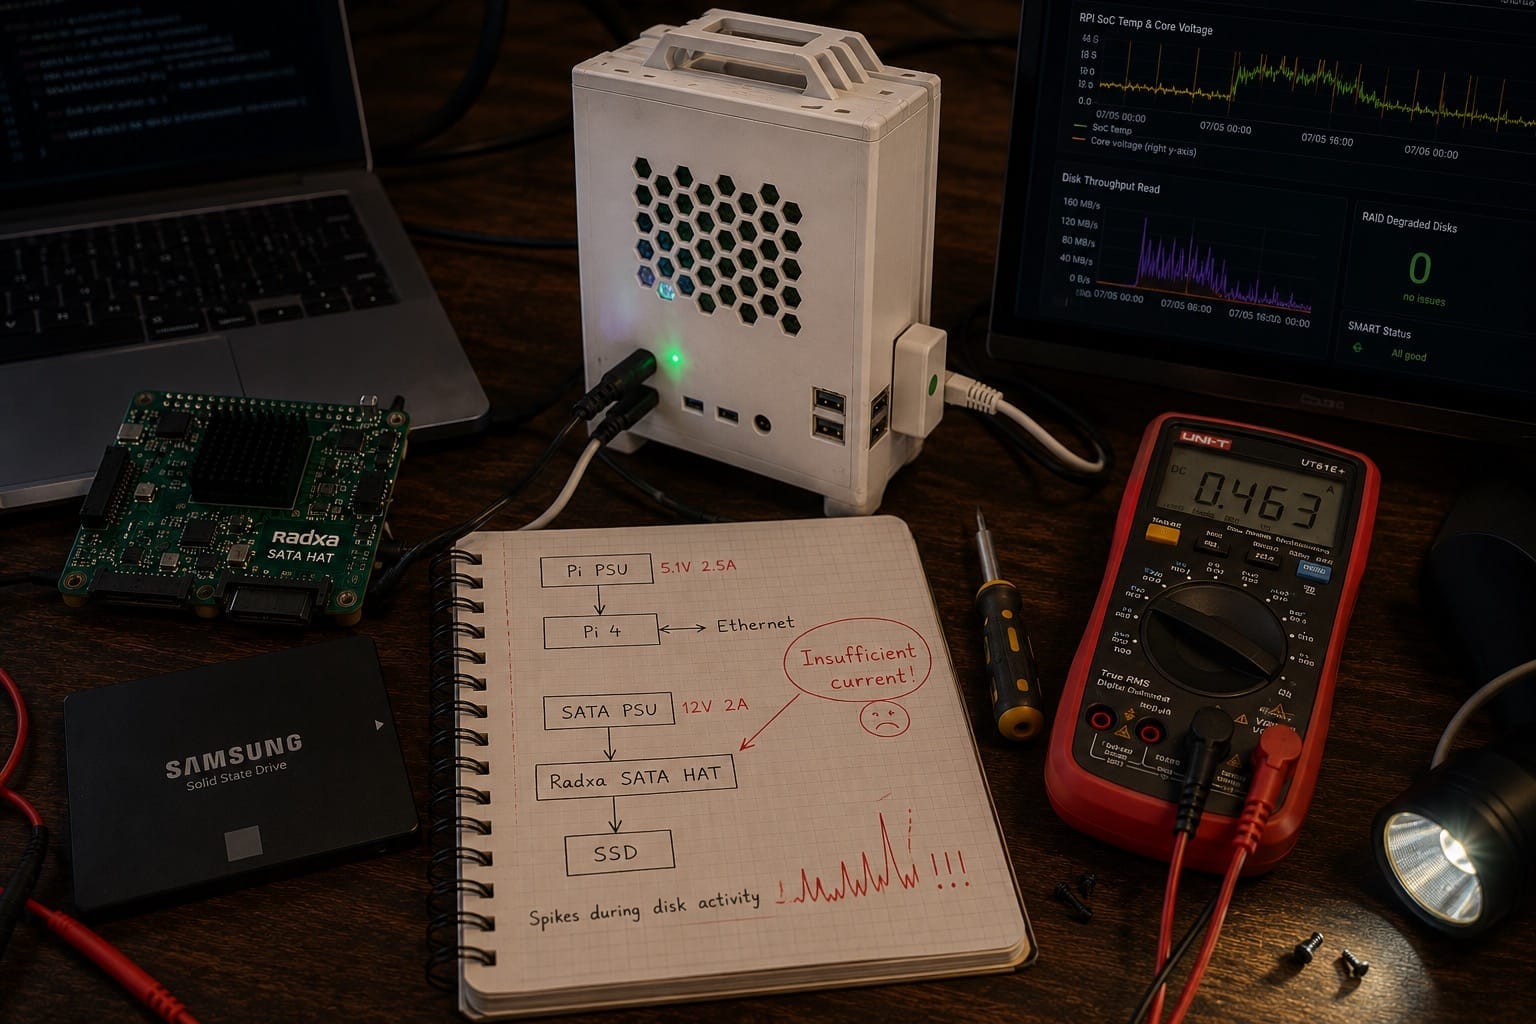
The Fix
The fix was not elegant. It was simply correct. I upgraded the power supply for the Raspberry Pi and also improved the power supply for the SATA HAT. The goal was to give both parts of the system enough headroom instead of running close to the edge.
The result was immediate. The mysterious disconnects mostly disappeared. The NAS became much more stable. The system stopped behaving like a random collection of unrelated failures and started behaving like infrastructure again.
That is one of the strange things about debugging hardware-adjacent systems. A weak power supply can look like a storage problem, a network problem, a RAID problem, or even a software problem. The symptom appears far away from the cause.
The Story Is Not Finished
This was not the end of all problems. The NAS is much more stable now, but it still has behavior that needs investigation. At the moment, one of the SSDs appears to heat up significantly roughly every few weeks. Sometimes this leads to RAID degradation and requires attention.
I do not yet know the exact cause. But the important difference is that the system is no longer a black box. I have metrics. I have history. I have alerts. I can compare temperature, disk activity, RAID state, and system load instead of guessing blindly.
The problem is not solved yet, but the way of working has changed.
And that matters.
Alerts Changed the System
After the power investigation, I expanded the monitoring setup even further. The NAS now reports RAID degradation. Disk health is monitored. Temperature trends are visible. The system can alert me when something goes wrong instead of silently waiting until I discover it by accident.
That does not make the NAS perfect. But it makes it observable.
And in practice, that is a huge difference. A home server does not need to be enterprise-grade to benefit from good monitoring. If it stores data that matters, it deserves visibility.
The Most Important Lesson
Looking back, the most expensive mistake was not choosing the wrong power supply. The most expensive mistake was believing too early that I already knew the cause.
I blamed OpenMediaVault because it was visible. I blamed Docker because it was easy to suspect. I looked at Samba, the network, RAID, and disks because they were close to the symptoms. But the real issue was underneath all of that.
This project changed how I approach systems. Before this NAS, I often treated monitoring as a nice addition. Something to add later. Something useful, but not essential.
After this debugging story, observability became one of the first things I think about when designing a system. Logs, metrics, dashboards, and alerts are not decoration. They are the difference between guessing and understanding.
And that lesson did not stay inside the NAS project. It influenced how I started thinking about every later project, from home infrastructure to Smart Calendar and notification systems.
If a system matters, I want to see what it is doing.
Because eventually something will break.
And when it does, I do not want to guess.